Performance reference
Measured on eight separate servers, not in Docker on one machine: a cloud database (8 cores, 32 GB), the proxy together with the relay (4 cores, 16 GB), a load generator (4 cores, 16 GB), and the databases of four organizations (2 cores, 4–8 GB each) at 0.19, 9.4, 38.7 and 43.3 ms round-trip time from the cloud. Postgres 18, fsync on, one scenario at a time; every point is 60 s after 15 s of warm-up, two repeats, the median. All figures are for this workload — access by primary key and by an (organization_id, id) index; another workload gives other numbers. Method, scenarios and raw results are in research/bench/; the numbers behind every chart are in charts-data.md.
The structure of the cost — which round trips an operation makes — and what to tune come first; the measured results follow.
Where the round trips go on fdw
Every statement on a moved organization through the fdw profile is executed by postgres_fdw in the cloud, which talks to the organization's database. Counted on the organization's statement log:
| Operation | What reaches the organization's database | Round trips |
|---|---|---|
| a single read | START TRANSACTION, DECLARE cursor, FETCH, CLOSE, COMMIT |
≈5 |
| an ORM-style read: a document, then the count of its versions | twice 5 | 10 |
| insert | PREPARE, EXECUTE, DEALLOCATE per INSERT, plus begin and commit |
3 per insert + 2 |
UPDATE or DELETE |
cursor FOR UPDATE, UPDATE … WHERE ctid = $1 (prepared), CLOSE, begin, commit |
8 |
| transaction | one START and one COMMIT for all its statements |
+2 |
| first statement of a new client connection | login (SCRAM), a tunnel stream, five SETs of postgres_fdw |
+9 |
The time of an operation is these round trips multiplied by the round-trip time to the organization.
UPDATEandDELETEcost 8 because LokaDB keeps row triggers on the foreign partition (__refs, the parent check, foreign keys to cloud tables, key maps); with a row triggerpostgres_fdwcannot push the whole statement down. Without them it would be 3.- The
+9per connection is why the cache of cloud connections (upstream_pool) is on by default for all databases ("upstream_pool": falseturns it off): a cloud backend and itspostgres_fdwconnection stay warm between clients. An application that connects per request (PHP, serverless) would otherwise pay these round trips on every request. - LokaDB itself sends nothing extra to the organization's database:
lokadb.org, the pause and__refslookups go to the cloud.
fdw+direct
A statement that touches only one organization's LokaDB tables goes straight to its database through the tunnel: about one round trip per statement, about one and a half including the cloud-side checks, instead of five to eight (measured inside a transaction, begin and commit included: a read about 3 round trips and an update about 2, against about 8 on fdw). This is why move-org sets fdw+direct whenever the direct-path credentials are configured. Keep fdw for organizations close to the cloud, or for workloads that mostly join an organization's tables with cloud tables (those go through the cloud on any profile).
An ORM feed with a join
A feed with a cloud join (Django select_related("project")…order_by("-id")[:20]) is addressed by the proxy to the organization's partition with the organization condition added, so ORDER BY runs in the organization's database and the cursor stops after the first rows, instead of the cloud pulling all of the organization's rows and sorting them. LIMIT under a join is not pushed down by postgres_fdw; ORDER BY is.
Tuning
- Indexes. A feed (
WHERE organization_id = $1 ORDER BY id DESC LIMIT 20) needs(organization_id, id), as without LokaDB. - Statistics of foreign partitions. Autovacuum does not analyze foreign tables; run
ANALYZE <parent table>while organizations grow, otherwise aggregates andLIMITare not pushed to the organization. - Connections. Leave
upstream_poolon. Turn ondirect_poolforfdw+directwhen clients connect per request. For applications that connect per request,"meta_cache": {"verify": "1s"}lets new connections skip the metadata freshness check (changes reach new connections up to a second later; live sessions learn at once). - When measuring: keep
route_logoff (one log line per statement costs throughput), do not record (-record), keep the metadata cache on. - Tunnel window. The multiplexer window is 4 MiB per stream by default (
LOKADB_MUX_WINDOW_KB): a stream is limited to window ÷ round-trip time, so a small window throttles reading a large organization over a long link. Larger windows add little and raise worst-case relay memory. fetch_size. LokaDB sets 1000 on organization servers (100 is thepostgres_fdwdefault): fewer round trips when reading many rows.
The cost of the proxy itself
The proxy adds a network hop, a set_config before statements on LokaDB tables, and parsing. A point read of one organization grows slowly with the number of organizations (see limits). A new client connection pays a metadata freshness check unless the shared metadata cache or the cloud connection cache absorbs it.
Proxy limits: max_connections (1000), max_message_bytes (256 MB), 30 s to connect and authenticate.
Measured results
Organizations that stay in the cloud
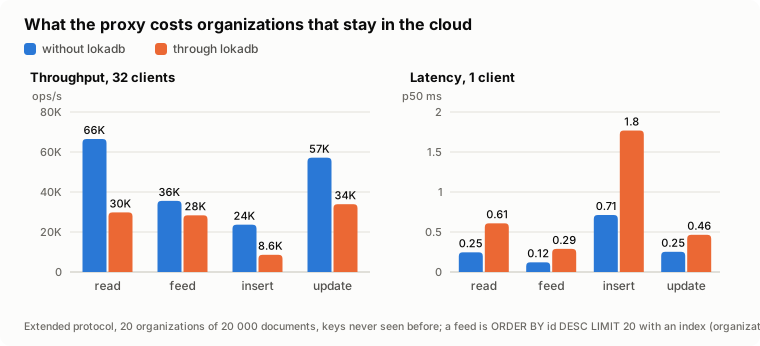
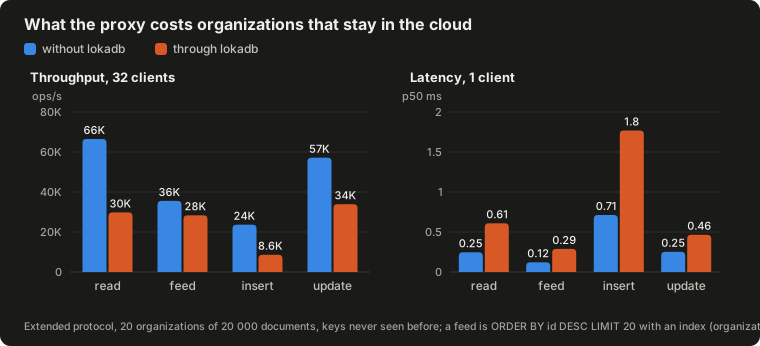
A statement costs 0.2–1 ms more through the proxy (p50, one client: read 0.25 → 0.61 ms, feed 0.12 → 0.29, insert 0.71 → 1.77, update 0.25 → 0.46). With 32 clients the throughput is 36–80 % of a direct connection: read 66,496 → 29,799 ops/s, update 57,166 → 33,880, feed 35,526 → 28,375, insert 23,673 → 8,612. A whole Django application with 16 clients was 5–10 % slower through LokaDB (read 2,008–2,127 against 2,239 ops/s, feed 2,830 against 3,030).
A new connection for every request
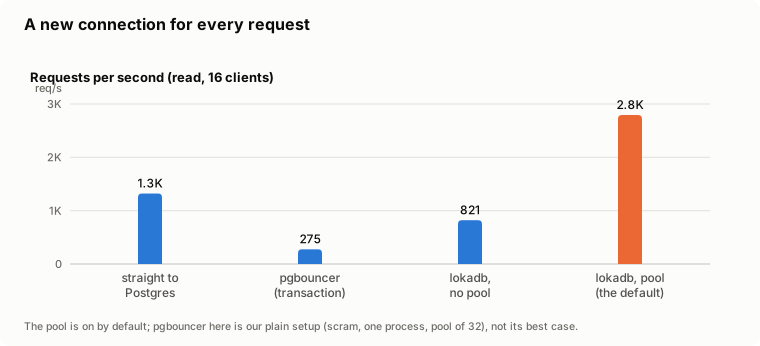
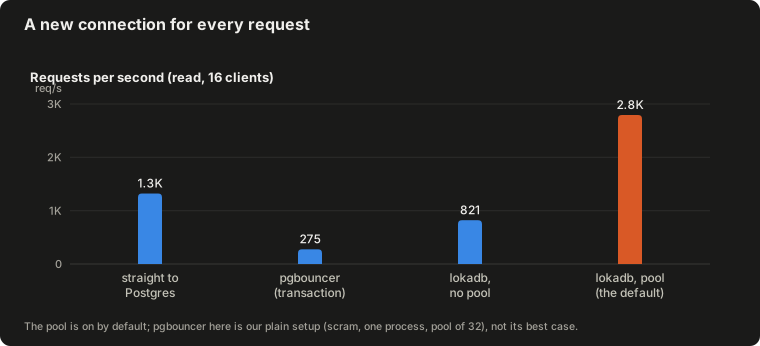
16 clients, one read per connection: straight to Postgres 1,321 requests/s; pgbouncer in transaction mode (our simple setup) 275; LokaDB with its built-in pool, on by default, 2,795 — about twice a direct connection. An application that already has its own pool sees no gain.
The price of distance
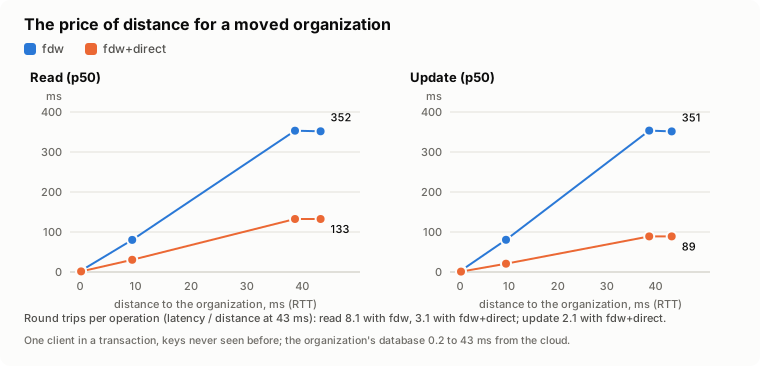
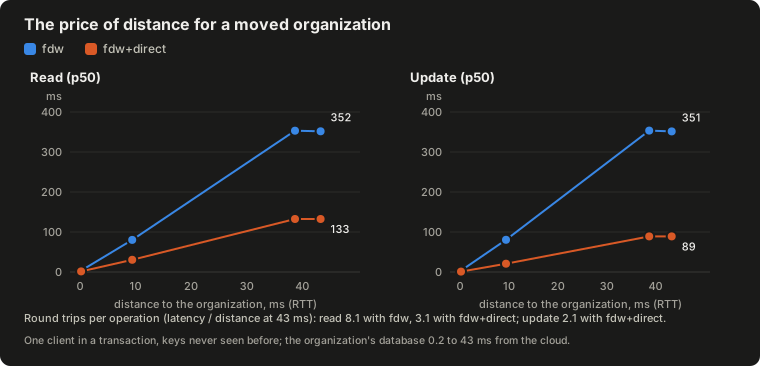
Latency of one operation of a moved organization in a transaction, one client, p50, by round-trip time from the cloud:
| RTT | read, fdw |
read, fdw+direct |
update, fdw |
update, fdw+direct |
|---|---|---|---|---|
| 0.19 ms | 3.5 ms | 1.4 ms | 3.4 ms | 1.1 ms |
| 9.4 ms | 80.3 ms | 30.5 ms | 80.5 ms | 20.8 ms |
| 38.7 ms | 353 ms | 133 ms | 353 ms | 89.1 ms |
| 43.3 ms | 352 ms | 133 ms | 351 ms | 89 ms |
Latency is almost linear in the round-trip time: about 8 round trips to the organization's database for a read through fdw (begin and commit included), about 3 through fdw+direct, and about 2 for an update on fdw+direct.
Thousands of organizations
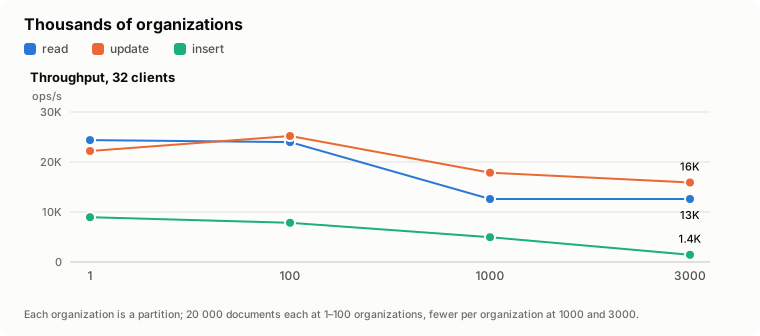
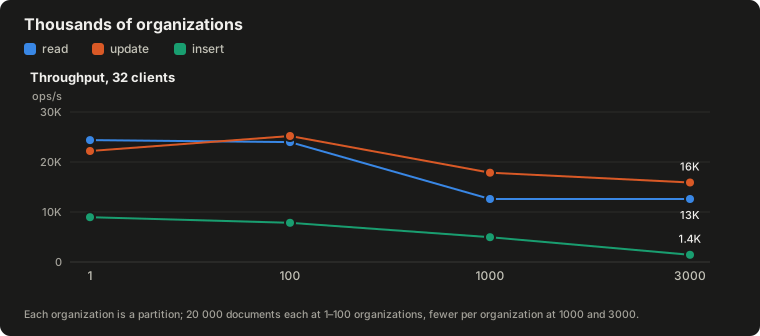
Throughput through the proxy, 32 clients, by the number of organizations (ops/s):
| organizations | read | update | insert |
|---|---|---|---|
| 1 | 24,371 | 22,209 | 8,952 |
| 100 | 23,984 | 25,194 | 7,846 |
| 1000 | 12,596 | 17,853 | 4,961 |
| 3000 | 12,606 | 15,908 | 1,432 |
Up to 100 organizations the cost does not grow. At 1000, compared with 100, reads lose about 47 %, updates about 30 % and inserts about 37 %; at 3000 inserts fall another 3.5 times (1,432 ops/s, p99 116 ms). A point read of one organization takes 0.55 ms with one organization and 1.1 ms with 3000 (one client); the first statement after connecting takes 1.6 ms with one organization and 14.8 ms with 3000. The mechanism is in limits.
Ceilings by the number of clients
Read and update, ops/s:
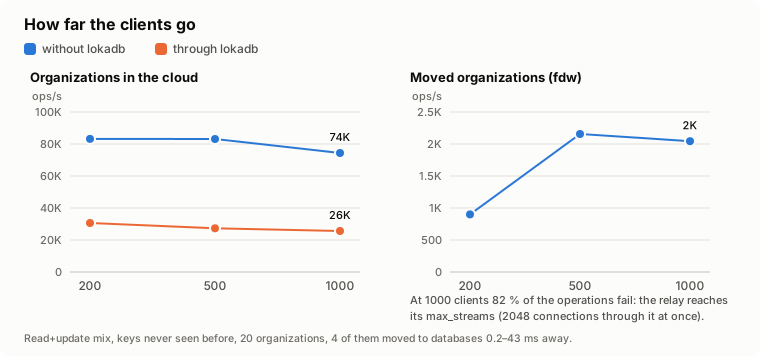
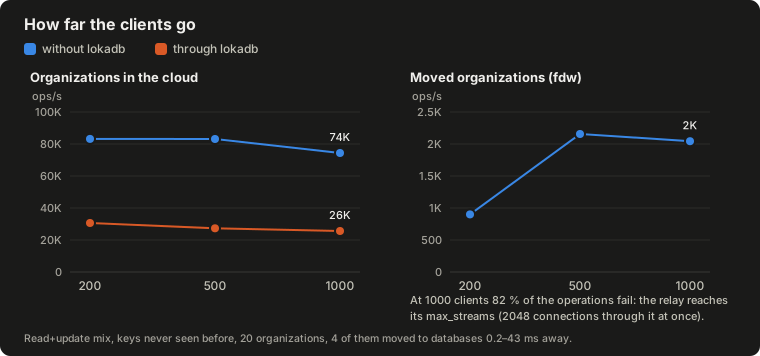
| clients | cloud, without LokaDB | cloud, through LokaDB | moved, fdw |
moved, fdw: operations that failed |
|---|---|---|---|---|
| 200 | 83,162 | 30,655 | 900 | 0 % |
| 500 | 83,095 | 27,286 | 2,156 | 0 % |
| 1000 | 74,397 | 25,608 | 2,044 | 82 % |
Moved organizations on fdw are limited by the network to the organization, not by the processor. With 1000 clients 82 % of the operations on moved organizations were refused a connection: in this scenario the relay's max_streams is the ceiling (2048 connections through the relay to all organizations together; every fdw client keeps its own connection to the database of every organization it touches). As an approximation for this scenario: clients through fdw ≤ max_streams ÷ the number of moved organizations a client touches, and not more than the organization database's max_connections and the agent's -max-conns. What helps: raising max_streams (relay memory up to 4 MiB per connection in the worst case), fdw+direct with direct_pool, a pooler in front of the proxy, fewer clients per organization.
Overload
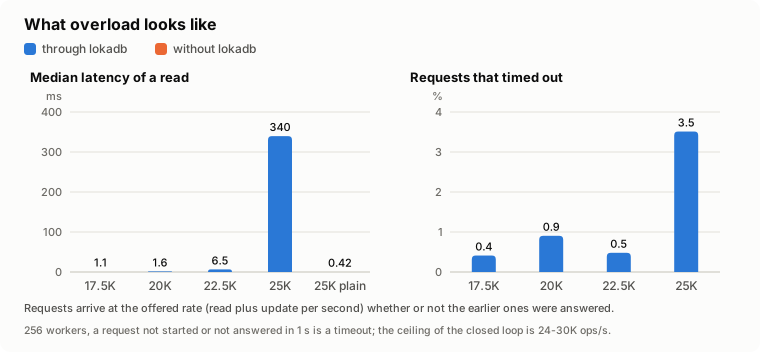
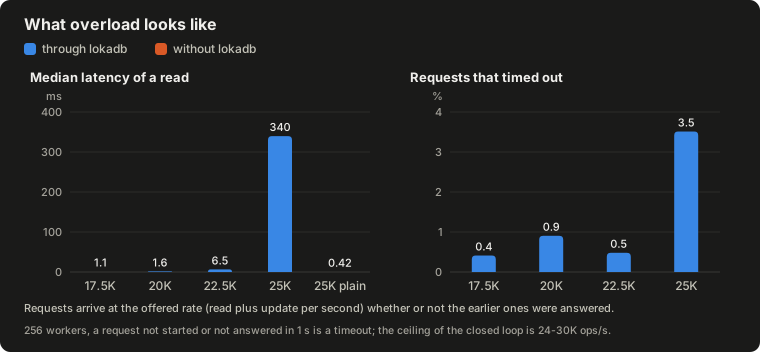
Open model: requests arrive at a set rate (256 workers, read and update, timeout 1 s), organizations in the cloud, through the proxy:
| offered ops/s | read p50 | read p99 | timeouts |
|---|---|---|---|
| 17,500 | 1.1 ms | 517 ms | 0.4 % |
| 20,000 | 1.6 ms | 536 ms | 0.9 % |
| 22,500 | 6.5 ms | 718 ms | 0.5 % |
| 25,000 | 340 ms | 1,019 ms | 3.5 % |
| 25,000 without LokaDB | 0.42 ms | — | 0.0 % |
Up to 22,500 ops/s the latency grows smoothly; at 25,000 the limit is reached, while the same rate is accepted in full without LokaDB.
Moving an organization under writes
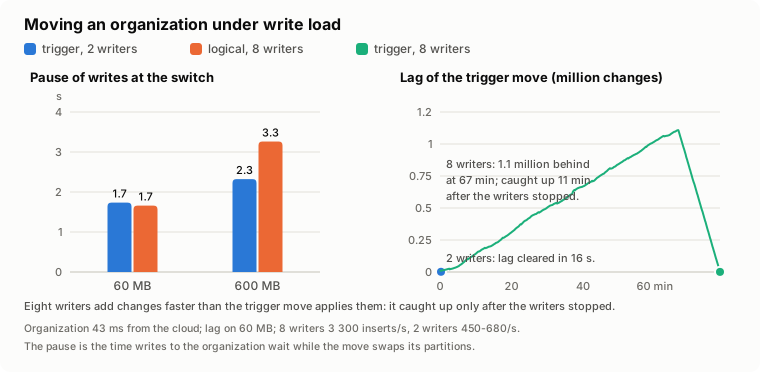
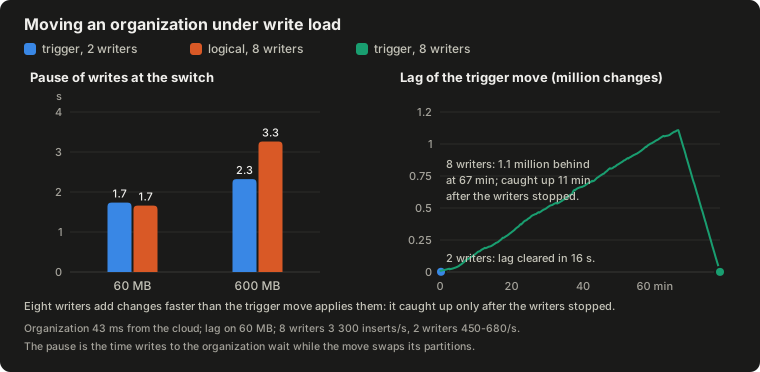
An organization 43 ms from the cloud, 60 and 600 MB, writers running all the time; the pause is the window in which the organization's writes wait.
| size | pause at the switch, trigger mode (2 writers) | pause at the switch, logical mode (8 writers) |
|---|---|---|
| 60 MB | 1.74 s | 1.66 s |
| 600 MB | 2.32 s | 3.26 s |
A 600 MB move takes about 8 minutes in both modes (trigger with 2 writers 464 s, logical with 8 writers 457 s); 60 MB takes 78 and 61 s. The first move of an organization out of the DEFAULT partition adds a pause of that organization's own writes (about 6 s at 60 MB, about a minute at 600 MB in this run). Trigger mode with 8 writers (3,300 inserts/s) does not keep up: changes arrive at about 1,845/s and are applied at about 1,570/s, so the lag grows by 275/s and converges only 12 minutes after the writers stop; with 2 writers (450–680/s) it converges at once. The drop in the writers' throughput in logical mode (760–1,160 inserts/s against 3,300) is the load of the initial copy by the subscription, not a lock. After every move the rows were verified: by organization in the right place, none of another organization's, growth equal to the number of successful inserts.
Other paths through the proxy
p50 for an organization in the cloud / a moved one through fdw: COPY out of a query (300,000 rows) 413 / 929 ms; COPY in of 10,000 rows 429 ms / 3.8 s (42 ms directly into Postgres); a cursor with a batch of 1,000 rows 2.7 / 5.0 ms; LISTEN / NOTIFY 0.57 / 0.39 ms. COPY <table> TO STDOUT without choosing an organization is refused by the proxy.
Failures
Stopping the database of one organization for 30 s gave errors to that organization only (1,191 of 2,633 operations); the other organizations got 0–1 errors in 2,700 and the cloud ones 0 in 42,000. Stopping an agent behaves the same (631 of 2,611). Connected agents cost almost nothing: a hundred extra add about 10 ms (2 %) to another organization's latency, and the relay holds 100 agents in 34 MB.
Serialization errors (40001)
Through fdw, a concurrent change of one row gives could not serialize access due to concurrent update: postgres_fdw opens a REPEATABLE READ transaction in the organization's database. This is an error the application must be able to retry: on hot keys up to a few percent of updates (6 % with 50 clients), on uniform keys about 0.03–0.1 %. It is safe to retry whole transactions made of reads and updates by primary key with no side effects; inserts without a unique key must not be retried (a retry can create a duplicate).
Improved after these measurements, not re-measured
- the pause of an organization's writes at its first move (the split out of the DEFAULT partition): measured 6 s at 60 MB and 66 s at 600 MB, of which about 53 s was the copy; the copy now runs while the organization works (a test with 300,000 rows under writes: 0.7 s instead of 12.5 s), and what remains under the pause is the
DELETEfrom DEFAULT, about 2 s per million rows; - a trigger-mode move under heavy writes (8 writers) did not converge; the catch-up now applies changes in rounds of up to 5,000 records or 8 MB in one pipeline;
- a relay restart took about 60–77 s before the agents were back; the drain is now 0–5 s and the agents are signalled to reconnect;
- thousands of organizations: prepared statements are no longer evicted from the connection's cache (re-planning at 1000 organizations fell from 81 % to 22 % of statements), and the connection pool is on by default.
Not measured yet
enable of a large table under writes and tables of 1–100 million rows; Laravel through LokaDB (Laravel without LokaDB was measured); a point at 48 ms; 200 agents (10, 50 and 100 were measured); loss of packets; moving 10 GB; managed Postgres and a real WAN beyond the four distances above.